Tests Under the Magnifying Lens
Testing is at the heart of engineering practices at SoundCloud. We strive to build well-balanced test pyramids within our code repositories and have as much test coverage as possible for different service use cases.
Here’s an x-ray view of the test pyramid in one of our largest codebases, the Android application:
As test suites grow and, more interestingly, cover more complicated integration cases, engineers have had difficulties when answering questions about the value, validity, and correctness of their tests. Some of the main challenges in building and testing at SoundCloud are pipeline-waiting times and test flakiness, respectively.
Data First

Test flakiness impacts teams in different technology stacks, both frontend and backend. In parallel, a challenge we commonly face is weighing tech health work against feature work to help product and engineering teams prioritize their work iterations.
As one of the efforts in leveling up our testing infrastructure — inspired by our peers in the industry (e.g. Spotify, GitHub, Google, Fowler, and Cypress) — we identified a potential improvement to our tooling, and we came up with a path to enabling cross-repository, cross-team, and cross-feature data aggregation and analysis that could potentially help us solve the aforementioned challenges by informing engineers and other non-technical stakeholders.
To do that, we must flip a common engineering view that test reports are outputs of the build process, and instead look at build artifacts as inputs to a next processing step in the engineering workflow.
In other words, every test report becomes a data point to help draw a curve that will support driving insights from the build pipelines themselves; track the test suites’ health, retries, and execution times; and more interestingly, help predict or bias an expected movement.
Finally, we aim to help prioritize refactoring or fixing tests so that they speed up test pipelines to reduce running cost and developer waiting times.
Backstage
With these targets in mind, we’ve come up with a service architecture backed by a data storage. For our requirements, all we need is a CRUD for data ingestion and manipulation, with some extended capabilities for rendering.
Ingestion
Given the service is aimed at integration with pretty much any stack, framework, or programming language — so as to attain wide internal adoption — we picked an agnostic scheme and designed an interface with as few assumptions about the data format as possible.
The first implementation for the tool is a thin Scala application with a Finagle+MySQL setup that ingests data via a REST API. It’s similar in skeleton to our production microservices, which means we leverage a lot of our existing toolkit for building and deploying the service, while also empowering engineers in the organization to contribute to improving the system by collaborating on a stack they already have experience with.
To minimize the effort of integration even further, we also provided a command-line tool, distributed through our private Docker registry, that knows how to translate some common test report formats (such as JUnit) into the expected schema for the service’s API.
That covers most of our use cases, since many of the testing libraries we rely on — such as the ones we run for our Android and pure Java applications — are capable of generating these XML reports. For other codebases, with ScalaTest, RSpec, and even Xcode, we rely on third-party and open-source integrations.
In practical terms, most teams simply add a step to their build pipelines, specifying a few parameters for the command-line uploader. Here’s an example from one of our GoCD pipelines:
stages:
...
- acceptance-test:
 jobs:
  acceptance-test:
   tasks:
   - exec:
    command: make acceptance-test
   - exec:
    run_if: any
    command: <docker run> -- automated-test-monitor-uploader \
     --system=api-mobile \
     --reports_dir=target/test-reports
At the end of the day, each of the teams can opt for a “vanilla” integration of their system by using the Docker image, but they can also choose to write their own report-uploading script to maximize the information they store in the database for querying later. This has even greater potential to allow teams to group and slice data through test cases’ metadata — for example, our Web Collective might tag their tests according to the browser they were run on, while our iOS team can use the device/OS version metadata for their use case.
Rendering
Once the data is stored in a structured way, the next step is to provide rendering capabilities so that teams can follow trends and the evolution of their datasets.
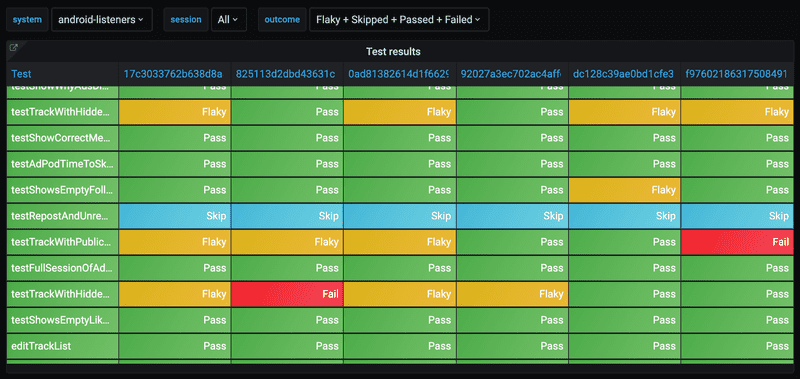
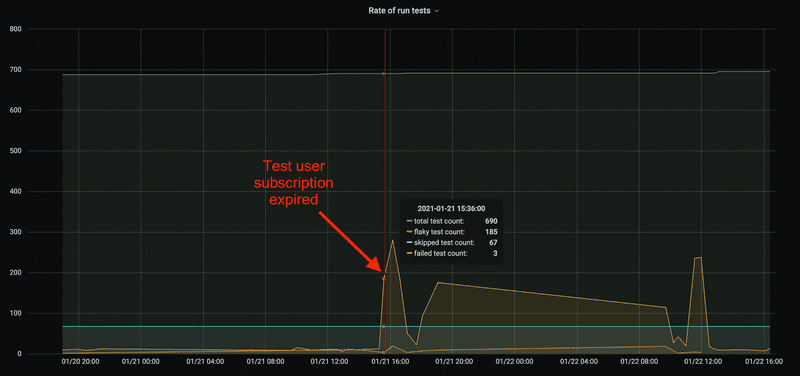
Here, we rely on first-party and third-party Grafana data source plugins, with some generic prebaked metrics we believe are useful for most cases. The plugins talk back to the ingestion service, executing queries to manipulate the data. This includes the number of builds and a drill down of test case outcomes, as well as rankings for the flakiest tests or the ones that might represent a bottleneck for the entire build pipeline.
Tests that take too long to run, on average, rapidly add up to decrease the overall engineer productivity by increasing waiting times in build queues and when running the suite locally. Not only that, but this slowdown potentially means higher costs for SoundCloud due to virtual/physical device time allocation in third-party device farms.
We found that Spotify’s Odeneye was a great way to identify both test flakiness and infrastructure problems, as the company itself describes:
If you see a scattering of orange dots this usually means test flakiness. If you see a solid column of failures this usually represents infrastructure problems such as network failures.
Leveraging the thin Scala application layer in front of the Grafana data source gives us extra power, allowing for further filtering and grouping to help understand outage scenarios before they hit developer productivity. On top of that, we have a better overview of the assumptions our code is making and where coverage might be lacking.
Alternatively, we also provide engineers, data scientists, managers, and other SoundClouders with direct access to our SQL entry point into the schema for a more “heads-down” approach, in which more flexibility allows for discoveries of team-specific metrics or even extraction of the whole dataset via dumping.
Action
Having data is the first step to be able to act on it, and each team has different practices for how they deal with test coverage, flakiness, and failures.
Some may visit the graph weekly to check on the trends, while others may only check when they experience build failures; some could create tasks in their ticketing system to regularly increase the codebase’s overall quality, while others might decide to set up alerts when specific metrics go above or below a certain threshold. The tool doesn’t enforce a given workflow, but it’s ready as support when teams decide to invest in technical health.
Eventually, we want to make the tracker for test execution available in a holistic way, so that we can answer questions like “How many failures did we have across all of SoundCloud over the last two weeks?” or “How has the rate of flakiness moved across all of SoundCloud in the last year?”


