Prometheus: Monitoring at SoundCloud
In previous blog posts, we discussed how SoundCloud has been moving towards a microservice architecture. Soon we had hundreds of services, with many thousand instances running and changing at the same time. With our existing monitoring set-up, mostly based on StatsD and Graphite, we ran into a number of serious limitations. What we really needed was a system with the following features:
- A multi-dimensional data model, so that data can be sliced and diced at will, along dimensions like instance, service, endpoint, and method.
- Operational simplicity, so that you can spin up a monitoring server where and when you want, even on your local workstation, without setting up a distributed storage backend or reconfiguring the world.
- Scalable data collection and decentralized architecture, so that you can reliably monitor the many instances of your services, and independent teams can set up independent monitoring servers.
- Finally, a powerful query language that leverages the data model for meaningful alerting (including easy silencing) and graphing (for dashboards and for ad-hoc exploration).
All of these features existed in various systems. However, we could not identify a system that combined them all until a colleague started an ambitious pet project in 2012 that aimed to do so. Shortly thereafter, we decided to develop it into SoundCloud’s monitoring system: Prometheus was born.
Prometheus is written in Go and has been open source from the beginning. Despite being intentionally quiet about it, we gained a few committed external users and contributors, most notably from Docker and Boxever. Since then, Prometheus has become the standard monitoring solution at SoundCloud. With the level of maturity reached, we would like to tell you more about it.
Our friends from Boxever and Docker are also publishing blog posts simultaneously about their usage of Prometheus:
Architecture
This diagram illustrates the overall architecture of Prometheus and some of its ecosystem components:
Prometheus servers scrape metrics from instrumented jobs, either directly or via an intermediary push gateway for short-lived jobs. They store all scraped samples locally and run rules over this data to either record new timeseries from existing data or generate alerts. PromDash (a web-based dashboard builder) or other API consumers can be used to visualize the collected data.
Prometheus’s main features are:
- A multi-dimensional data model.
- A flexible query language to leverage this dimensionality.
- No reliance on distributed storage; single server nodes are autonomous.
- Time series collection happens via a pull model over HTTP.
- Pushing time series is supported via an intermediary gateway.
- Targets are discovered via service discovery or static configuration.
- Multiple modes of graphing and dashboarding support.
See also the Overview section of the documentation.
Data model
Prometheus fundamentally stores all data as time series: streams of timestamped values belonging to the same metric and the same set of labeled dimensions. Timestamps have a millisecond resolution, while values are always 64-bit floats.
The metric name specifies the general feature of a system that is measured. For
example, a metric to count the total number of HTTP requests received by an API
server might be called api_http_requests_total. Adding labels (key/value
pairs) to this metric enables Prometheus’s dimensional data model: any given
combination of labels for the same metric name results in a separate time series.
One example time series for this metric might represent all the received HTTP
requests that used the method GET for querying the endpoint /api/tracks and
resulted in a 200 HTTP status code. For naming a time series like that, we
use this notation:
api_http_requests_total{method="GET", endpoint="/api/tracks", status="200"}The query language then allows filtering and aggregation based on these dimensions. Prometheus’s label-based data model is fundamentally the same as the one of OpenTSDB and even has a similar syntax.
Metrics in Prometheus have a type to indicate their meaning and usage. Prometheus currently supports three metric types:
- A counter is a cumulative metric that represents a value that only ever goes up, like a request count.
- A gauge is a metric that represents a value that can arbitrarily go up and down, like a temperature or a queue length.
- A summary is a client-side calculated histogram of observations, usually used to measure request durations or sizes.
For more information on Prometheus’s data model, see the Data model and Metric types sections in the documentation.
Query language
The Prometheus query language allows you to slice and dice the dimensional data for ad-hoc exploration, graphing, and alerting. We’ll talk about the use of the query language for dashboards and alerting in the next two sections. Your first steps with the query language are best done using the expression browser offered by each Prometheus server.
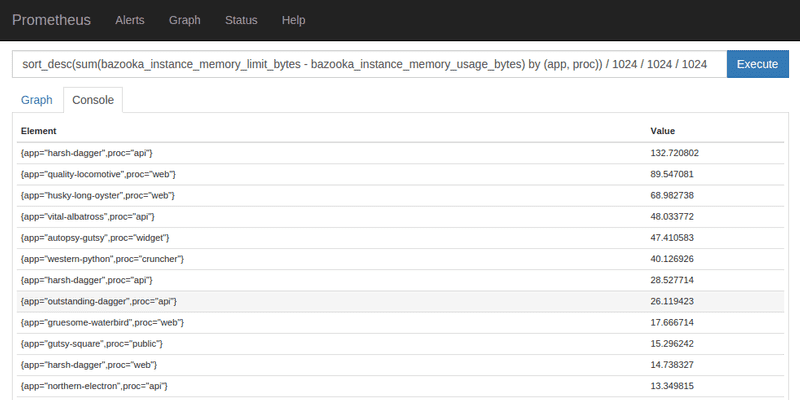
As an example, we have instrumented Bazooka, our internal Heroku-style deployment system, with Prometheus. This provides us with per-instance metrics about memory usage, memory limits, CPU usage, out-of-memory failures, instance restarts, and so on. Each of these metrics is labeled by application, process type, Git revision, environment, and instance ID. This has frequently been useful for debugging both single-instance problems, as well as for doing cluster-wide resource usage analysis. For instance, badly-configured Bazooka applications might set large container memory limits, yet not use a lot of the reserved memory. This screenshot shows a query for the worst RAM wasters across a Bazooka cluster (click the image to view a full-sized version):
Similar queries allow us to identify potentially misconfigured applications and reach out to their developers.
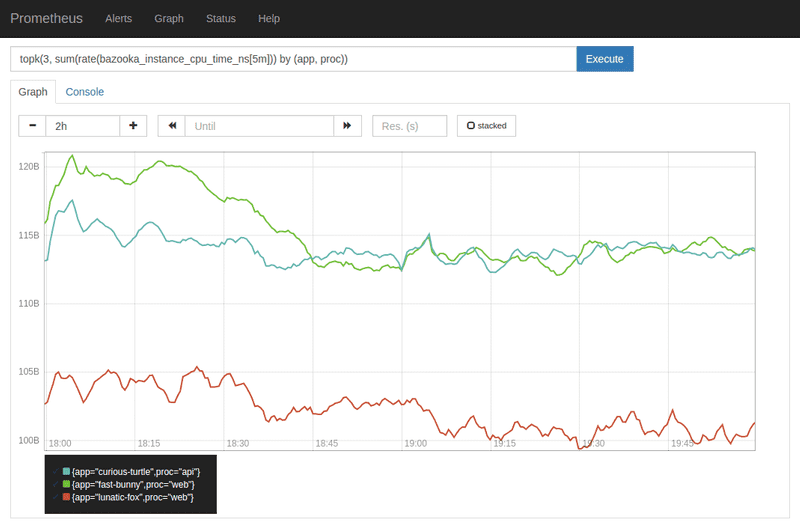
As another related example, we might want to graph the top three CPU users on a Bazooka cluster as measured over the last five minutes, grouped by application and process type:
For intense queries that take a long time to evaluate, you can configure Prometheus to precompute them in the background. Precomputed expressions are called rules. They have a name, which is used like the name of a metric in other expressions.
For more details about the query language, see the documentation.
Dashboards
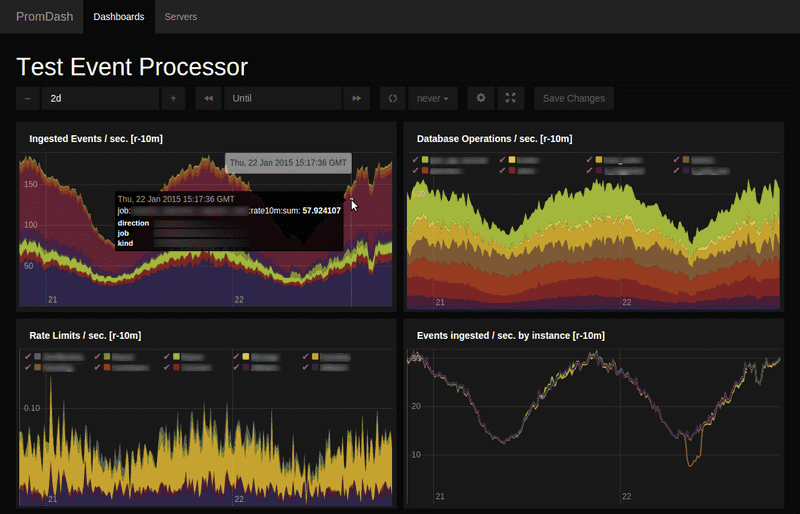
The one-stop solution for the fanciest dashboards is PromDash, a GUI-based dashboard builder with a SQL backend. It talks to any number of Prometheus servers via an HTTP API and graphs their data in highly configurable dashboards. Even Graphite graphs can be included.
If you want to serve simple dashboards from the Prometheus server directly (without the need of a separate application with SQL backend), have a look at console templates. SoundCloud uses PromDash as its main way for visualizing Prometheus data.
Alerting
Alerts are defined using the same powerful query language described above. A separate binary, the Alertmanager, handles alert notifications and aggregations and enables silencing by any label set. If an alert fires, Alertmanager can send an email or page you through an external alerting service like PagerDuty.
We also offer a Nagios plugin as a bridge from the parts that are already monitored by Prometheus to the existing Nagios alerting set-up that many companies have in place. In fact, SoundCloud uses exactly that configuration for production alerting, which is why the Alertmanager is still less mature than the rest of the Prometheus ecosystem. We plan to move to fully native Prometheus alerting soon.
For more information, see the documentation about configuring alerting rules and alerting best practices.
Storage
One of our goals was to run a Prometheus server with millions of time series and tens of thousands of samples ingested per second on a single server using its local disk. You might think everything should be distributed-something nowadays, but distributed systems demand payment in complexity and operational burdens. How many of you would love to run OpenTSDB but shy away from maintaining a whole Hadoop cluster just for that? With Prometheus, you shard servers by function and run multiple replicas of the same shard for redundancy. Cross-server queries are not possible, but we are working on a hierarchical federation scheme where a higher-level Prometheus server collects selected metrics from subordinated Prometheus servers.
Designing the local time series database for Prometheus was an adventure of its own. We explored and compared many existing local storage implementations. Based on our research, we decided to use LevelDB for indices and our own design for storing the actual sample values and timestamps.
The disk storage of a server is naturally limited (depending on the rate of incoming samples, we usually keep several weeks or months around, without any downsampling), and the disk can fail permanently (resulting in data loss, at least on that one replica). Whoever requires true durability of samples will need some kind of distributed storage. Prometheus already has experimental support for streaming collected samples to OpenTSDB as a permanent storage, turning the Prometheus ecosystem into a collection machinery for OpenTSDB. One day, we would like to support the complete round-trip, i.e. Prometheus queries can read data back from OpenTSDB. Other time series databases might get support too, but the differences in the data model are a challenge.
Getting your service ready for Prometheus
Prometheus-style monitoring relies on instrumenting your own code directly. This is very different from traditional strategies to monitor applications, where the monitored application is often completely ignorant of the monitoring system, which uses plugins or agents to talk to the application in its own language. The high-quality service-based monitoring you get from your handwritten instrumentation is usually worth the price.
To instrument code, we offer client libraries for Go, Java, and Ruby. As the Java client library is usable from any JVM language, this completely covers the needs of SoundCloud. A Python client is also under development. These client libraries allow you to track and expose metrics over HTTP. The default exposition format is protocol buffers, but we also support a very simple text-based format, which can be used for easy “library-less” exposition of metrics even from shell scripts.
To mimic the ways of traditional monitoring approaches, there are a number of exporters for certain types of servers, like the HAProxy Exporter to export metrics of an HAProxy or the Node Exporter to export varius node attributes.
Finally, if you have short-lived jobs like cronjobs that cannot wait for Prometheus to scrape them, there is the Pushgateway, to which you can push metrics. The Pushgateway will then present these metrics permanently to Prometheus for scraping.
Conclusion
Prometheus has proven to be very useful at SoundCloud. It drives our internal monitoring, facilitates firefighting during outages and provides further insight into them for postmortems. We run Prometheus as an open-source project because we believe it can benefit the infrastructure community as a whole. If you are interested in getting involved, check out the Prometheus community.
Special thanks to Matt T. Proud, who initially started the Prometheus project.


