What Is New with Periskop in 2022
In a previous blog post, we explained how we built an internal pull-based exception monitoring service called Periskop — which is heavily influenced by Prometheus — which we open sourced.
The adoption of this tool at SoundCloud has proven successful during the past year. Currently, it’s a Golden Path tool in our observability stack, and it’s particularly key when an incident happens. Many teams started using Periskop as part of their debugging workflow — even those that still have to maintain legacy systems that don’t use SoundCloud’s default technical stack.
This increased use encouraged us to improve Periskop by adding more functionality and releasing more open source projects for the Periskop ecosystem.
In this post, we’ll discuss recent updates we made to Periskop and its ecosystem. Many of the new features explained here were mentioned in the previous blog post as part of future work.
Official Website and New Organization
We’re happy to announce that we have our static site pointing to http://periskop.io. We also moved all related Periskop repositories to a new GitHub organization called periskop-dev. The goal of this is to change the governance model to one that’s more community-centric and not exclusive to SoundCloud. This lines up with our mission of making Periskop the go-to tool for exception reporting in the cloud native ecosystem.
Client Libraries
Since we opened Periskop to the community, we wanted users of different languages to also use Periskop for their programs. Initially, we developed a client library for Scala, which is the technology we use the most internally. Later, we started adding more client libraries, and there are currently four:
The development of periskop-go was especially interesting, as Periskop uses it to scrape itself to capture any error that occurs during its execution.
Persistence
We built Periskop with simplicity in mind: deploy and run. Software that’s similar to Periskop — like Sentry — requires provisioning a database if you want to deploy the service internally to store all the exceptions.
With Periskop, you can simply deploy using in-memory storage for the exceptions. This has the downside that if you redeploy your Periskop instance, the captured errors won’t persist. However, this usually isn’t a problem, since most of the time, if the scraped service had the errors reported in memory (via a client library), the errors would be scraped again.
To solve this problem, we decided to extend Periskop, providing the ability to store exceptions in a persistent storage. Currently, Periskop can be configured to use persistent database systems such SQLite, MySQL, and PostgreSQL. Documentation on how to achieve this can be found in part of this README.
Push Gateway
We also wanted to provide push capabilities to Periskop. This is especially useful for shortlived processes like batch jobs or fork-based application servers. In the Prometheus documentation, you can find plenty of good examples and a detailed explanation as to why a push gateway is useful.
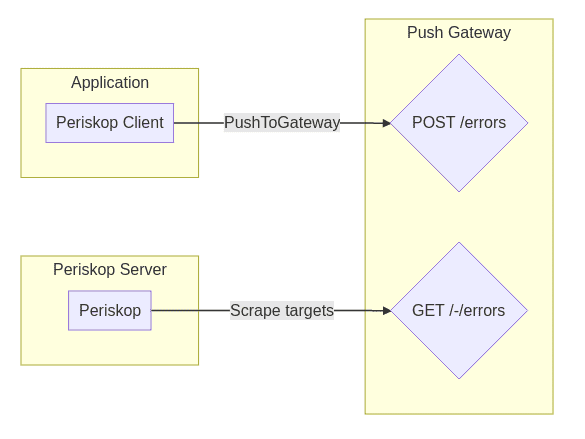
The following graph shows the architecture of the push gateway.
Basically, it’s a simple Go service that you can deploy as a sidecar container. Client libraries can use the push_to_gateway method pointing to the address and port where the service is deployed, pushing any exported metrics to the gateway.
We use it in production for our monolith written in Rails with periskop-ruby. There’s Rack middleware, which handles exceptions that may happen during the execution of a request, and it pushes them to the attached push gateway of the deployed service.
Service Discovery
As we’re following the principle of Prometheus, but for exceptions, we also wanted to have the same service discovery mechanism that Prometheus has in place. This pull request shows how this was achieved and how we can configure Periskop to use Prometheus service discovery.
User Experience Improvements
We introduced several improvements to the UI that make Periskop more user friendly — especially when searching or filtering for a specific error during an outage. These are the main improvements:
- Search for errors — We had an initial search functionality that was only searching for the error name. We extended the search functionality to search any text within the reported errors. This is particularly useful when searching for a specific endpoint or for an error message.
- Filters and sorting — We added the ability to filter per severity type and sort errors per number of occurrences or the date of last occurrence. Thanks to Tiago Taquelim for the contributions!
- Mark errors as resolved — We also added the option to mark errors as resolved. This comes in handy if you fix a bug, you deploy it, and you don’t want it to be in the UI anymore.
Prometheus Metrics Support
All reported errors are instrumented using Prometheus metrics. In the documentation, there’s a basic example of an alerting definition for Alertmanager.
What’s Coming Next
Some of the ideas we have in mind for continued improvement and added features include:
- Built-in federation (hierarchical collection)
- Time series visualization
- More integrations (Backstage, Grafana)
- Support for more language and frameworks
- Labeling of errors
Periskop is open source, and we’re happy to accept external contributions! If you find this project useful, we’d love to hear from you. Please drop us a line at our gitter chat.

