One line of Python, and a 3× drop in p99
We removed one log statement from a service’s hot path this week. Its 99th-percentile response latency fell from a steady ~48ms to ~18ms, and CPU usage dropped by about the same factor. The cleanest way to see it: before the change, p99 never went below 40ms at any hour of any day. After it, p99 never went above 40ms. The two distributions barely touch.
In the first hour after the deploy - the daily traffic trough - p99 touched 5ms. That number is real, and it is not the one to quote. The difference between those two readings is most of what this post is about.
The interesting part isn’t the number. It’s that we spent a while looking for the cost in the wrong place, and the thing that eventually found it was measurement rather than code reading.
Some context
If you listen to SoundCloud for free, you hear ads. How many and how often isn’t a fixed schedule; the backend decides it per listening session. Part of that decisioning now runs through an internal service: a request comes in describing the current session, and the service returns an action - show an ad pod of a given size, or don’t - along with a cooldown.
Two properties matter for this story:
- first, it sits directly in the ad-serving request path, so its latency is not an offline concern; it’s user-facing
- second, it serves several policy variants behind the same API, and those variants don’t all use the same inputs.
That second property is where the bug came from.
The API contract, and a caller that doesn’t need it
The service’s decision endpoint accepts a posteriors field: the per-action statistical state a Bayesian policy needs in order to pick an action. Callers that want a learned policy send it.
But not every variant is a learned policy. Some run a fixed policy - a deterministic rule with no per-action state at all. Those callers send no posteriors, by design, because there is nothing meaningful to send.
The endpoint had a validation guard that looked, in essence, like this:
# Log warning for missing actions
missing_actions = all_actions - provided_actions
if missing_actions:
    logger.warning(
        "Posteriors missing for actions",
        request_id=request.request_id,
        missing_actions=missing_actions,
    )
    for action in missing_actions:
        MISSING_POSTERIORS.labels(segment_id=request.segment_id, missing_action=action.name, version=version).inc()
The intent was reasonable: if a caller sends posteriors for some actions but omits others, that’s a real anomaly worth surfacing. The implementation didn’t distinguish that case from “this caller sent none at all, as expected.”
The action space has four entries, so a caller that sends nothing has all four “missing.” For every fixed-policy request the service emitted a structured warning and four metric increments. For zero signal. And that turned out to be effectively all of its traffic: every policy variant then receiving requests tripped the guard, on every request. Not a hot path with an occasional expensive branch - a hot path with an unconditional one.
Worth being precise about scope. This service sits behind SoundCloud’s ad-serving stack - a high-volume, continuously-hot path that decides ad load for listening sessions across the platform, around the clock. It currently takes the experiment-allocated slice of that traffic, which is already substantial, and the intent is for ad-load decisioning like this to cover a growing share of free-tier listening. Whatever the guard cost per request, it cost it on 100% of them - and that alone was enough to hold p99 nearly three times above where it needed to be. At the volume this is heading for, that is not a rounding error.
None of this was gratuitous. The warning and the counter were deliberate instrumentation - MISSING_POSTERIORS fed a dashboard panel that let us watch, per policy variant, whether callers were sending the state they were supposed to. The log line had been there for a while. Nothing was broken. Alerts were quiet. It simply cost more than anyone had priced in.
The wrong theory first
The initial hypothesis was string formatting: building the log message - serialising the set of missing actions, interpolating the request ID - on every request, and paying for that work whether or not anything consumed it. That’s a well-known Python cost and a plausible culprit.
We never isolated it with a benchmark, and we should be honest about that. What argues against it is the memory graph: if the cost had been building strings and objects we immediately discarded, we would expect the win to show up in allocation. Per-pod memory moved only from ~170–175MB to ~150–160MB - real, but nowhere near proportional to the latency change. The cost was in writing the line, not building it.
That distinction matters because it changes the general lesson. “Don’t format strings you might not log” is a micro-optimisation. “Don’t emit a log line on 100% of hot-path traffic” is an architectural constraint.
Why the write is expensive is not mysterious once you look at it: a structured logger renders the event, serialises it, and writes it to stdout synchronously, inside the request. That write goes to a log collector. The serialisation holds the GIL, so no other handler runs during it; the write itself releases the GIL but still parks that request mid-flight. Averaged across all requests it disappears into the mean, which is why nobody had noticed it. It surfaces in the tail - here it was most of the tail.
The fix
- # Log warning for missing actions
+ # Only a real anomaly when the caller sent SOME posteriors but omitted a few.
+ # Callers using hardcoded_policy (e.g. promoted) send none by design, so treating
+ # "all missing" as an error emitted a structlog warning + 4 metric increments on
+ # 100% of traffic for zero signal.
  missing_actions = all_actions - provided_actions
- if missing_actions:
+ if missing_actions and request.posteriors:
Five insertions, two deletions - and four of the five are the comments explaining why. The guard now fires only when a caller sent some posteriors and omitted others, the case it was written for. Callers that send none pass through silently.
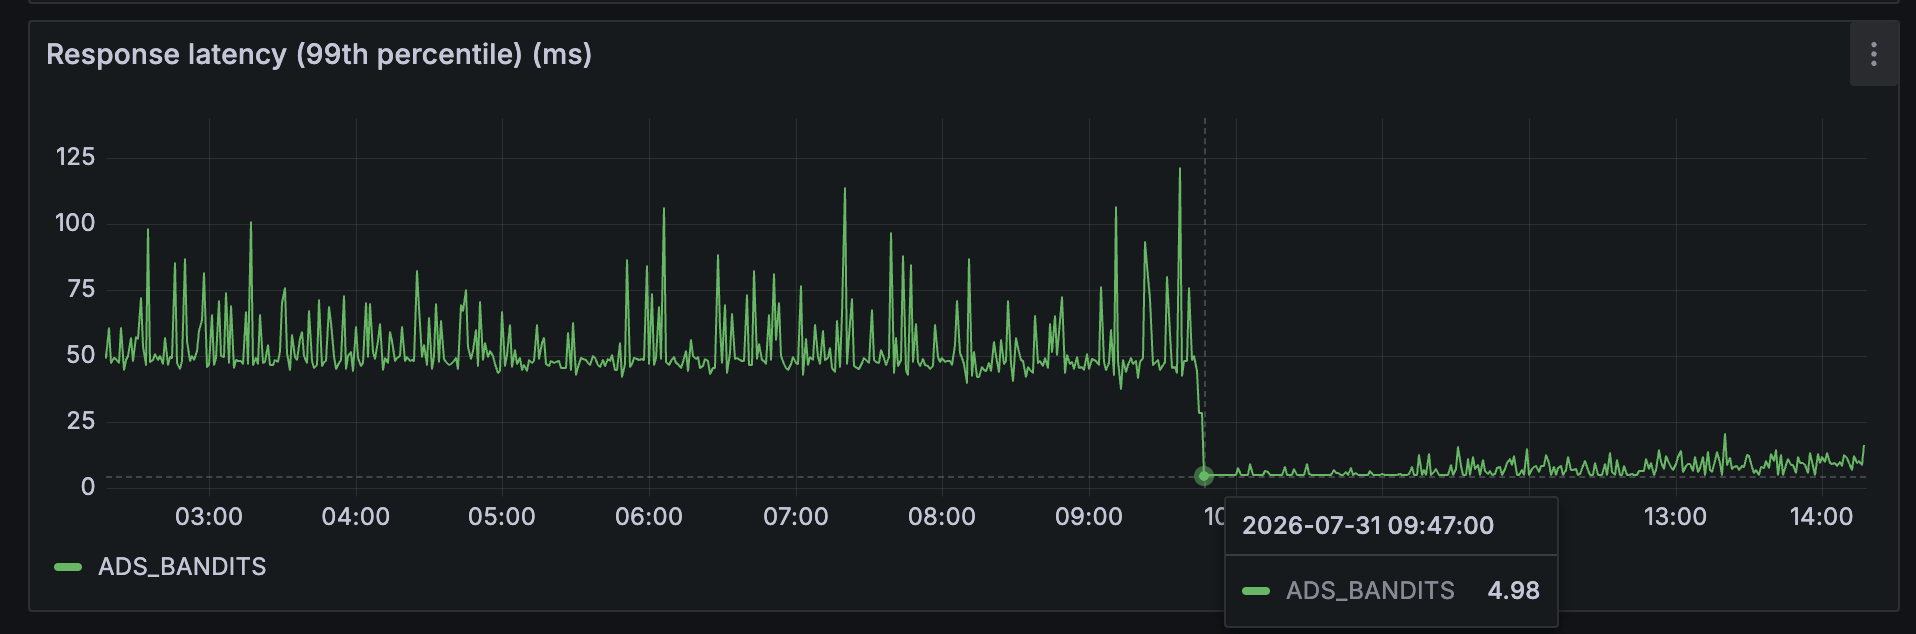
Deploy completes at 09:47 UTC. p99 goes from a ~50ms band with regular spikes past 100ms to 4.98ms - a single step, no ramp. This is the trough reading; see the seven-day view below for where it settles.
A few things are worth reading off that dashboard carefully, because they’re what make the attribution credible rather than suggestive:
- It was a single-commit deploy
- The service had not shipped for a week
- The only functional change between the previously running image and the new one was that one guard condition. There is nothing else to credit.
The old level was a plateau, not a bad morning. Over the two days before the deploy, p99 sat in a ~45–55ms band continuously, with regular spikes past 100ms, through two complete daily traffic cycles - from the evening peak all the way down to the quietest hour of the night. It never dipped below 40ms at any point, at any volume, including at troughs quieter than the ones the fixed service now handles at 18ms. This wasn’t a transient we caught at a lucky moment.
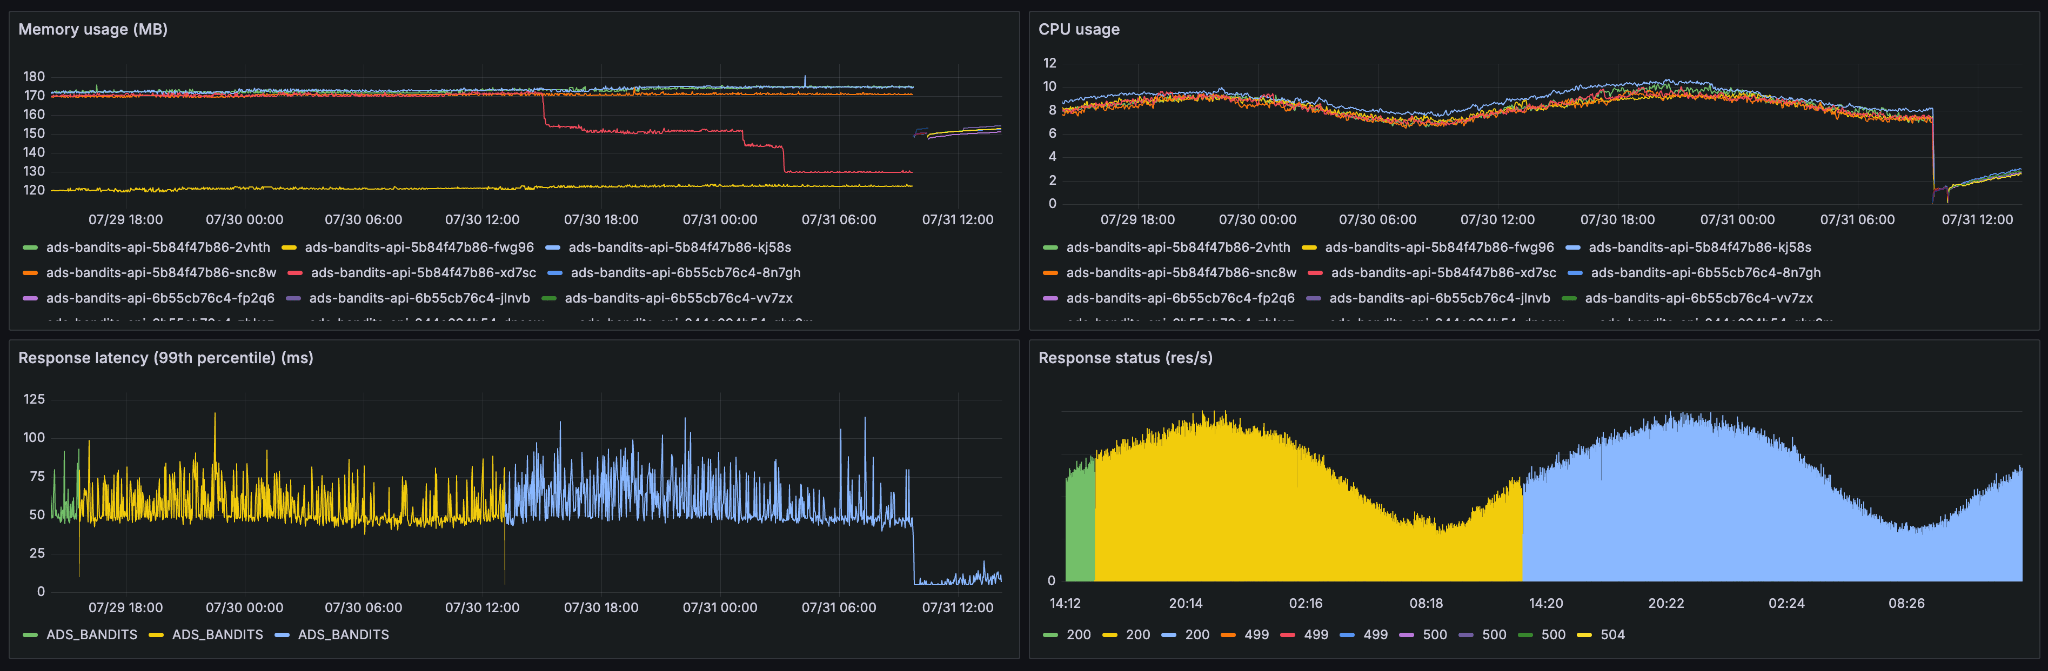
The same dashboard across two full traffic cycles. p99 (bottom left) holds its ~50ms band through both the evening peak and the morning trough, then steps down at the deploy. CPU (top right) sits at 8–10 and falls to 2–4. Request volume (bottom right) is strongly diurnal, which is what makes the flat pre-deploy latency band meaningful.
Where it actually settled
The graph above ends a few hours after the deploy, and if we had stopped there we would have published the wrong number. The deploy landed near the daily trough. Over the following days, as load returned, p99 rose off 5ms and settled into a ~15–25ms band, spiking to 35–40 at peak - holding there through four subsequent evening peaks at full traffic.
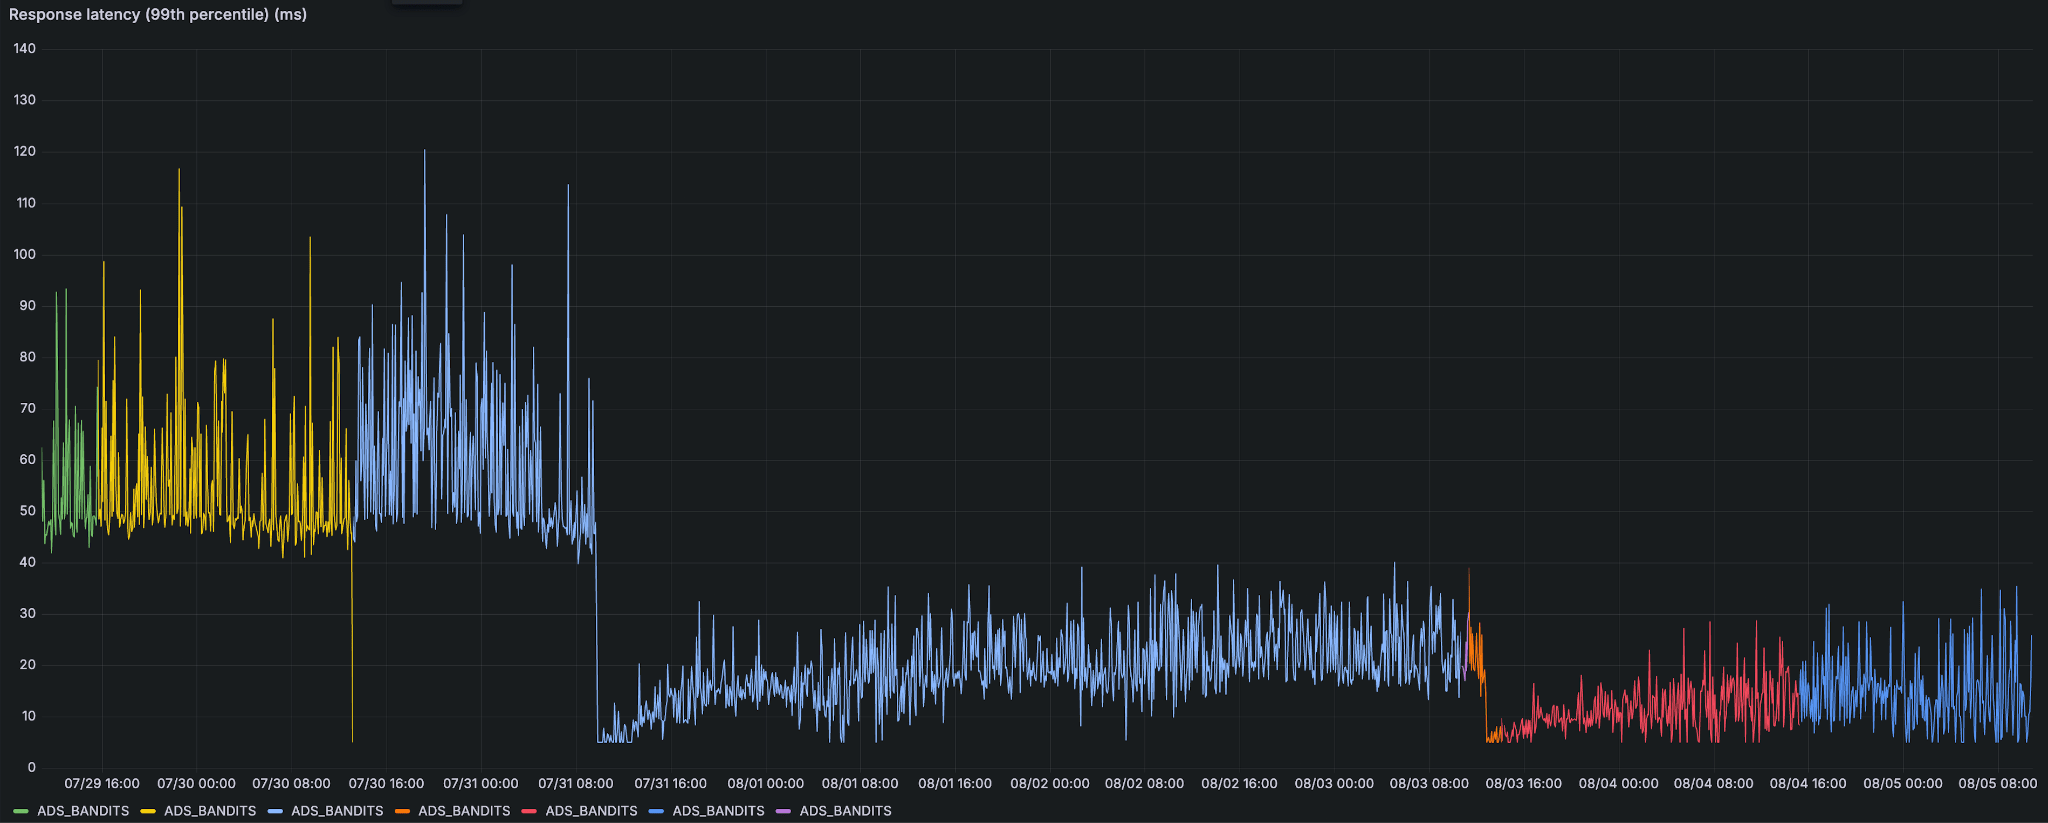
A week of p99 around the 07/31 deploy, about two days before and five after. The important feature isn’t the step - it’s that the two bands don’t overlap. Before: a ~45–55ms band that never dipped below 40ms (the single vertical drop on 07/30 is a pod rotation, not a latency reading), with spikes to 120ms. After: a ~15–25ms band that never exceeded 40ms.
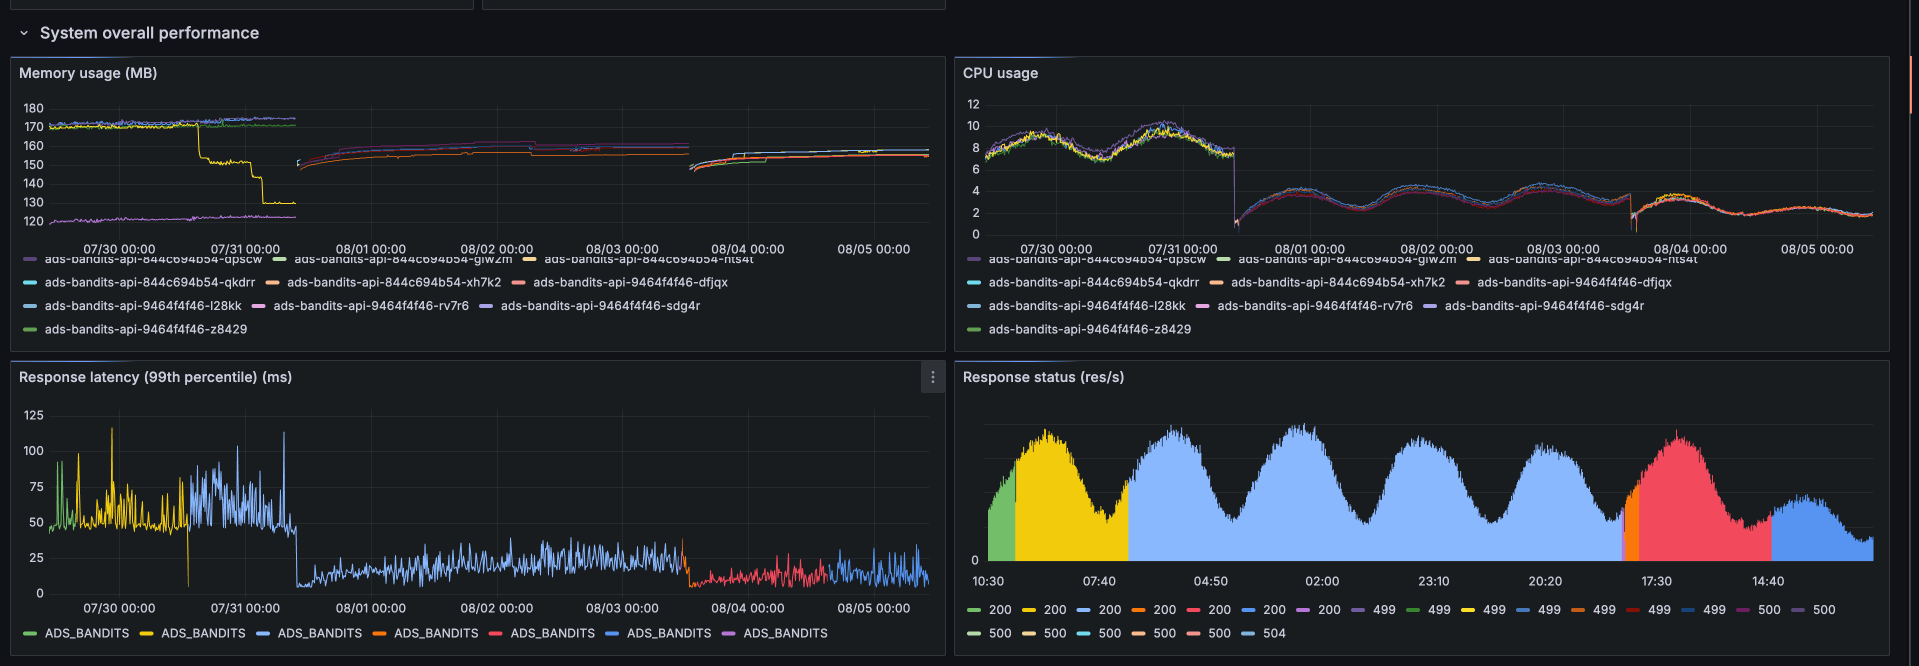
Memory, CPU, p99 and request volume across the same week. CPU tracks the latency win - 8–10 down to 2–4 - while memory moves only slightly. The diurnal request pattern (bottom right) is what pulls p99 up off its post-deploy floor.
One scoping caveat: a second deploy on 08/03 took CPU down again, to ~1–2, and p99 to a ~10–15ms band - a separate change that moved a per-request config lookup to startup. Every number above is measured against the 07/31–08/02 window, before that landed, so if anything the current service is faster than this post claims.
So the honest claim is ~48ms → ~18ms sustained, not 50ms → 5ms. Just under 3×, through peak load, on a single commit - and the non-overlap is the part worth keeping: the best hour of the old service was worse than the worst hour of the new one. Quoting the 5ms trough figure would have been an unforced error.
The second-order win
The nicer outcome wasn’t the latency. It was that a check nobody could act on stopped pretending to be a signal.
The missing-actions metric had been firing constantly, so its dashboard panel was a solid wall of noise - useless for spotting the real anomaly it was built to catch. After the fix it went flat at zero.
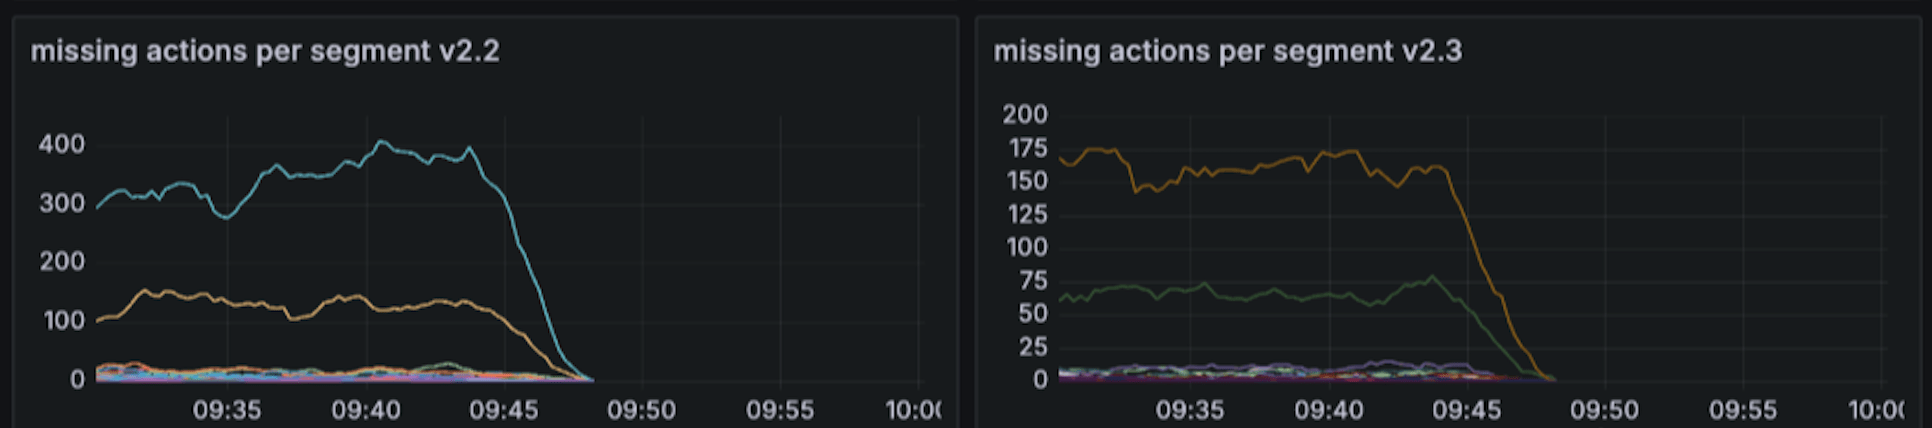
The missing-actions counters going to zero at 09:47–09:50, broken out per policy variant and user segment. Every series is the same expected absence reported as an anomaly.
A metric pinned at zero isn’t meaningful either - the interesting case is visible in the logs - so it came out in a follow-up cleanup.
Two things had been quietly wrong at once, and they were the same thing: a check that couldn’t tell “expected absence” from “unexpected absence” was both expensive and blind.
What we’d take from this
An unconditional log line is a hot-path dependency, not a detail. This one put a synchronous write to a log collector inside every request, and under the GIL that write blocks every other handler. It cost nothing in the mean, which is why it survived as long as it did. It cost most of the tail, which is where users live.
Latency was the symptom; capacity was the finding. p99 is what users felt, but the same guard was eating roughly two thirds of the path’s CPU - 8–10 down to 2–4 at identical traffic. A cost paid on 100% of requests compounds with every percentage point of rollout, so hot-path waste is cheapest to find before the traffic arrives.
“Missing” is not one condition. Absence that a caller intends and absence that indicates a bug need different handling. Collapsing them produces alerts nobody can act on - and here, a bill nobody had noticed.
Measure before you optimise, including your own explanation. The formatting theory was plausible, cheap to believe, and would have led to a fix that bought almost nothing.
Wait a week before you quote a number. Our first reading was taken at the daily trough, which made a 3× win look like 10×. The inflated number is always the one that travels: it’s the more exciting claim, it’s true for about six hours, and it would not have survived contact with the first person to open the dashboard a week later. Let a change ride through a full traffic cycle before you attach a number to it.
If a signal is always firing, it isn’t a signal. A metric pinned at a constant value is either measuring the wrong thing or measuring a bug. Either way it’s worth five minutes of attention, not a permanent dashboard panel.