Keeping Counts In Sync
Track play counts are essential for providing a good creator experience on the SoundCloud platform. They not only help creators keep track of their most popular songs, but they also give creators a better understanding of their fanbase and global impact. This post is a continuation of an earlier post that discussed what we do at SoundCloud to ensure creators get their play stats (along with their other stats), both reliably and in real time.
A long time has passed since we shared about the challenges of and our approach to real-time stats. Since then, we’ve had to expand our infrastructure to cope with the continuously growing stream of events representing plays, likes, downloads, and other important social signals that we’d like to count and present to creators. As a result, what might seem like a simple counting system is actually a cornucopia of services orchestrated to power features like creator statistics, reporting, search, and recommendations. The list goes on and on.
 What We Talk about When We Talk about Counts and Statistics
The main challenge for a statistics powering system is that we not only need to present summed up totals for arbitrary time ranges, but we also need to allow creators to dig into these summed time ranges with dynamic granularity. For instance, when someone is interested in a week of play counts, aside from displaying the totals for that week, they might like to see the daily performance as well. Ideally, the total of those days should add up to the total shown for the week, and when zooming in to a specific day, all the hourly counts would be shown as well.
Another challenge is keeping the total counts of plays, likes, reposts, and other signals we would like to display for a certain track updated. These counters offer an aggregated view of the entire time a track is present on our platform, and they are ubiquitous in that they are visible everywhere a track is displayed. Because, most of the time, these counters are public, they are requested from the service several orders of magnitude more times than the actual stats that are only visible to the individual creators.
 Current Solution: Stitching Counts
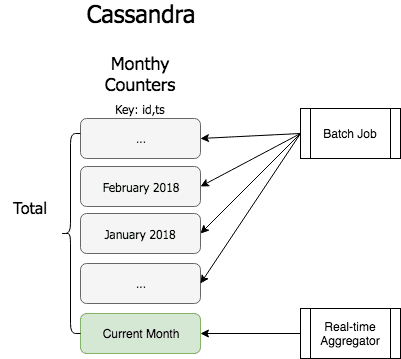
As highlighted in the aforementioned post, our system Stitch is at the heart of the stats and counters. Stitch pre-aggregates events over several dimensions to answer queries efficiently. The main dimension is time, and the buckets consist of hourly, daily, and monthly partitions. The second dimension is the different type of events, of which the play events are the most abundant, making them the most challenging to keep updated. On top of all this, we are doing this pre-aggregation for every track, along with a summation of every creator’s overall stats and counters.
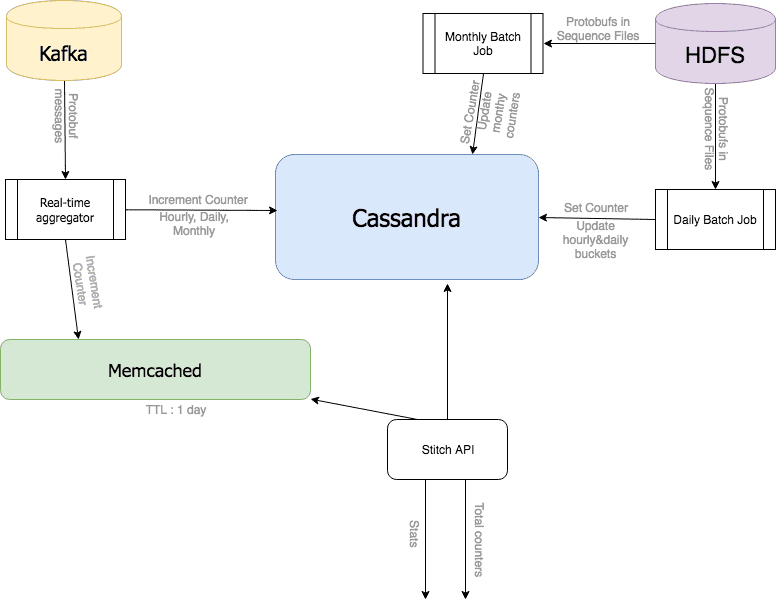
Stitch architecture is an incremental Lambda Architecture. Instead of always regenerating the serving layer from the beginning of time, we only generate the changed buckets of hours, days, and months. Batch counts for the current day — including hourly batches — are handled with a daily job, and batch counts for the current month are handled with a monthly scheduled job.
We’ve chosen this way of regenerating the serving layer in batches from the end of the last batch calculation performed because play counts do not generally come from the past (with the exception of things like spam and backfills from bugs in the event pipeline). Creators also tend to expect monotonically increasing play counts over time, although this property is not valid for counts of “likes” or “reposts” that could actually go down as well.
With this setup (shown and described above), we have the possibility of swapping or recalculating certain days or months of data, but usually we don’t need to, so long as everything goes fine (as in no bugs and no network failures or other outages). The Crunch batch jobs run in our Cloudera-flavored Hadoop cluster over data ingested and archived by our event pipeline based on Kafka. Both the batch and the real-time layer convert the Protobuf event messages into increments and sum them up in their specific buckets.
The batch-generated “serving” layer and the real-time or “speed” layer, as coined in the Lambda Architecture, both use Cassandra as their primary data store. In the batch layer, we use the Sorted String Table (SSTable) loading feature of Cassandra to effectively ingest even several months of data. For the speed layer, we took a different approach of leveraging the distributed counters feature, issuing every increment (or decrement for comment, repost, or like counts) as a database update.
The Stitch API constitutes the query layer that consolidates (or should we say stitches) the real-time view and the batch-aggregated numbers seamlessly as a unified response to the clients of the service.
Total Counts
Given that the system aggregates counts by the creator, track, and time, answering total counts on a given track for all time requires fetching by all track and time buckets. Given this constraint, we added a caching layer to store total counts for a given track. To lower the pressure on our Cassandra cluster, we added a Memcached cluster to serve approximately the top 90 percent of the most requested total counters.
We increment both the source-of-truth counters in Cassandra and the cache counters in real time, but in order to limit the divergence of the two views, we invalidate the entire cache on a daily basis with a randomized time to live (TTL) parameter. The randomization is needed to lower the probability of highly accessed track counters all invalidating at the same time, which would cause periodic spikes in our cluster usage. The invalidation is needed because our event pipeline only supports at-least-once delivery and the updates are not transactional.
Top Lists
As part of our stats product for creators, we offer various top lists, thereby allowing them to gain more insight into their audiences and track performances. This system is responsible for generating and serving these lists in a way similar to how Stitch provides counts. By connecting to the same event pipeline, the system aggregates the events and creates partitioned top lists for every dimension we’re interested in, such as the most played tracks for a creator for a day.
One of the challenges we’ve faced in splitting these two facets of the same product into two different systems is keeping the two views in sync by scheduling them at the same cadence and always triggering recalculation on all the systems affected by a problem. Additionally, it’s important to run spam filtering and throttling as part of a common processing unit upstream in the event pipeline.
There is another system that provides global top lists. It relies on the same event stream and is a good example of the versatility of having a consistent pipeline that can be tapped into by several decoupled systems. That said, it faces challenges similar to those of the aforementioned stat product for creators in terms of consistency of the numbers and ordering.
 Alternatives
Our internal engineering culture is driven by RFC-based decision making, and one of the key points in these collaborative documents is finding alternatives to the presented solution.
Additionally, while growing and optimizing a system, it’s important to properly assess whether it’s actually the right thing to do or else consider that maybe it’s time for a radical change. Every time we have to grow our Cassandra cluster or fine-tune the batch jobs to cope with more and more data, we get a tingling feeling that maybe this is not the way forward. The inherent tradeoffs we’ve made around using more storage for query efficiency, or dealing with caching and invalidation, or having to reconcile different views of the same dataset, were all predicated on older knowledge of the problem and solution space.
By exploring the alternatives (sometimes over and over again) we are able to substantiate our choices. In the case of Stitch, we tried out most of the following approaches, either during SAT (self-allocated time), or as scheduled spikes to improve our systems, but none resulted in a breakthrough that would justify fundamentally changing our current setup (yet).
Always Count
Historically, we started with a huge database of all events. Every time a statistic or a total count was needed, we issued a query to this database to actually count all the events in real time. This quickly became infeasible and we started extracting this functionality into dedicated databases, and finally into our current Stitch system.
With “Fast Analytics“ databases “buzzwording” around, it might be time to revisit this approach. By storing these increments in columnar stores that provide efficient analytical queries, we could use less storage than the pre-aggregation approach does. Analytical databases like Amazon Redshift, Google BigQuery, Apache Kudu, or even Vertica provide results in seconds, but not milliseconds (as our current approach does). Maybe a hybrid approach like FiloDB, implementing columnar storage on top of the Cassandra store, could be a valid alternative.
Pre-Aggregate Differently
Our current solution relies heavily on pre-aggregation, so another approach would be to use a different pre-aggregation scheme by leveraging some funky data structures like Fenwick trees. The main challenges would be in creating efficient distributed versions of these prefix sum data structures.
One viable way could be by leveraging the partitions already present in our Kafka-based event pipeline and building stateful services by continuously consuming events, similar to Kafka Streams, and providing a query API on top of these mini stores.
Another challenge is augmenting algorithms to not only result in total counts for a range, but to efficiently calculate all the individual data points for a specific range and granularity. When we tried out this alternative, we represented the trees as sparse arrays, utilizing fast integer-packing algorithms implemented in JavaFastPFOR to lower the serialized footprint of the data. Nonetheless, the overall latencies were not as performant as the Cassandra store approach, and the complexity of the code was significantly higher. Essentially, we were reimplementing a database.
Another alternative would be to only aggregate data that will be queried. This would trade some initial latency for a queried period for a substantial amount of storage and potentially unused computation time. We could take user requests and pipe this into an adaptive caching system.
 Back to the Drawing Board
As already stated above, none of these approaches has resulted in us changing our setup, because of extra operational/engineering overhead and the unacceptable increase in latency they would require. However, it has taught us valuable lessons about engineering tradeoffs and the challenges of keeping things synchronized and consistent, and we remain open to exploring new ways of keeping track of counts.
Special thanks to Anastasiia Basha, Jeff Kao, and Natalye Childress for all the help on this post, and of course to other past and present SoundClouders who have contributed to continuously evolving these systems. If you are interested in solving these kinds of challenges, please check out our jobs page.

