Building the new SoundCloud iOS application — Part II: Waveform rendering
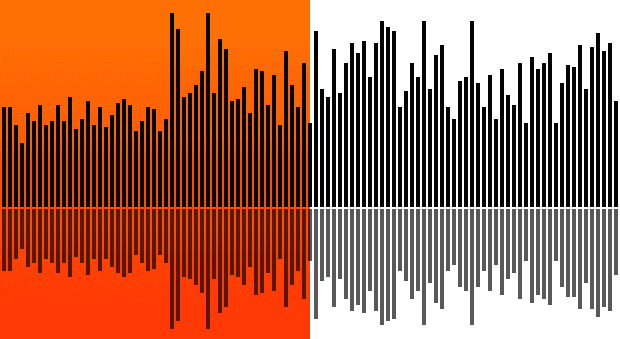
When we rebuilt our iOS app, the player was the core focus. The interactive waveform was at the center of the design. It was important both that the player be fast and look good.
Initial implementation
We iterated on the waveform view until it was as responsive as possible. The
initial implementation focused on replicating the design, which heavily used
CoreGraphics. A single custom view calculates the current bar offset based on
its time property. It then draws each of the waveform samples that are in the
current visible section of the waveform. Each sample is either rendered as a
filled rectangle for unplayed samples, or by adding clip paths to the context
then drawing a linear CGGradient for the played samples.
To handle progress updates, we used the callback block on AVPlayer:
[player addPeriodicTimeObserverForInterval:CMTimeMake(1, 60)
                                     queue:dispatch_get_main_queue()
                                usingBlock:^(CMTime time) {
    [waveformView setPlaybackTime:CMTimeGetSeconds(time)];
}];
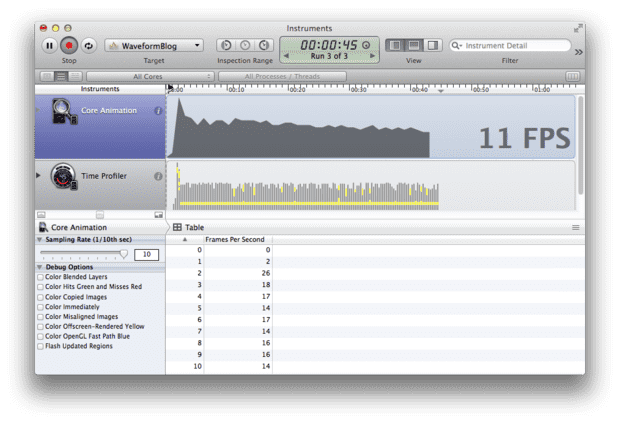
This generates 60 callbacks per second to try and achieve the highest possible frame rate. This solution worked perfectly during testing on the simulator. Unfortunately, testing on an iPhone 4 did not produce similar results:
The preceding trace displays an initial frame rate of 17 FPS that drops to 10 FPS
over time. As time progresses, there are more played waveform samples, which are
expensive gradient fills and take more CPU time than unplayed samples. The CPU profiler
displays that 90% of CPU time is spent in the drawRect: method of our waveform view.
Reducing waveform renders
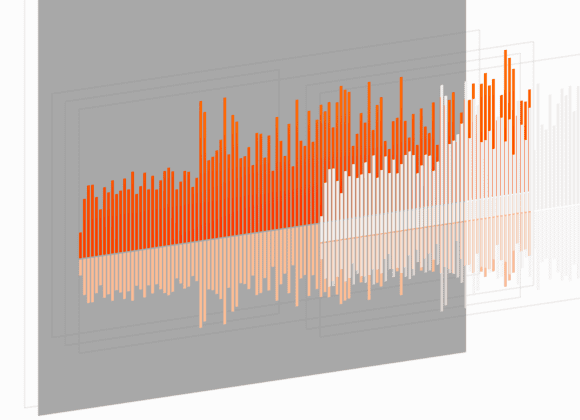
We needed a new approach that did not require redrawing the entire waveform 60 times a second. The waveform samples never need to change in size, but only in tint color. This makes it possible to render the waveform once, and apply it as an alpha mask to a layer filled with a gradient on the left half, and white on the right half.
This increases the FPS to the maximum of 60 with approximately 50% GPU usage. The CPU usage dropped to approximately 10%.
Using system animations
We can now stop using the AVPlayer timer
callback for waveform progress and use a standard UIView animation instead:
[UIView animateWithDuration:CMTimeGetSeconds(player.currentItem.duration)
                      delay:0
                    options:UIViewAnimationOptionCurveLinear
                 animations:^{
                    self.waveformView.progress = 1;
                }
                completion:nil];
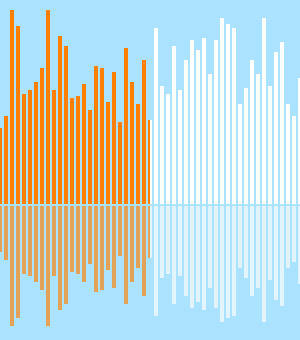
This drops CPU usage down to approximately 0%, without noticeably increasing the GPU usage. This would seem to be an obvious win, unfortunately it introduces some visual glitches. Watching the animation on longer tracks shows an amplitude phasing effect on the waveform samples.
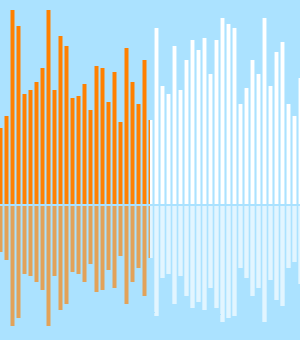
| Pixel-aligned waveform rendering | Interpolated waveform rendering |
|---|---|
|
|
While the mask is animated across the waveform view, the animation will not only be drawn at integer pixel positions. When the mask is at a fractional pixel position, it causes the edges of the mask to be interpolated across each of the neighboring pixels. This reduces the alpha of the mask at the edge of each sample. This lower alpha reduces the amplitude of the visible waveform samples. The overall effect is that as the mask is translated across the view, the waveform samples animate between a sharp dark state and a lighter blurry state.
We need a way to tell CoreAnimation to only move the mask to pixel-aligned positions. This is possible by using a keyframe animation that is set to discrete calculation mode, which does not interpolate between each keyframe.
A high-level API was added for keyframe animations in iOS7, but the CoreAnimation interface in this case is a bit clearer:
- (CAAnimation *)keyframeAnimationFrom:(CGFloat)start to:(CGFloat)end
{
    CAKeyframeAnimation *animation =
    	[CAKeyframeAnimation animationWithKeyPath:@"position.x"];

    CGFloat scale = [[UIScreen mainScreen] scale];
    CGFloat increment = copysign(1, end - start) / scale;
    NSUInteger numberOfSteps = ABS((end - start) / increment);

    NSMutableArray *positions =
    	[NSMutableArray arrayWithCapacity:numberOfSteps];
    for (NSUInteger i = 0; i < numberOfSteps; i++) {
        [positions addObject:@(start + i * increment)];
    }

    animation.values = positions;
    animation.calculationMode = kCAAnimationDiscrete;
    animation.removedOnCompletion = YES;
    return animation;
}
Adding this animation to the mask layer produces the same animation, but only at pixel-aligned positions. This has a performance benefit; animating longer tracks produces animations with the FPS reduced to the maximum possible FPS for the number of animation keyframes, which reduces the device utilization accordingly. In this case, the distance of waveform animation is 680 pixels. If the played track is 10 minutes long, the FPS is 680 animation pixels over 600 seconds ≈ 1 pixel position per second. CoreAnimation schedules the animation frames intelligently, so that we only get a 1 FPS animation with correspondingly reduced 1% device utilization.
Increasing up-front cost for cheaper animations
The CPU performance is at an acceptable level, but 50% GPU usage is still high. Most
of this is due to the high cost of masking, which requires a texture blend on the GPU.
As we fetch a waveforms samples asynchronously for each track, initial render time for
the view is less important than performance during playback. Instead of masking the
waveform samples, they can be drawn twice: once in the unplayed
state, once in the played state with gradient applied. That way, each waveform is
contained in separate views that clip their subviews. To adjust the waveform position
within these windows, the bounds origin can be adjusted for each subview to slide over
its content, similar to how a UIScrollView works.
You can offset the bounds origin of the left clip view by its width. The result is a seamless view that looks exactly the same as the masking effect. Because we are only moving views around in the hierarchy, redrawing does not need to occur and the same keyframe animations can be applied to each of the clip views. After applying these changes, the GPU utilization drops to less than 20% for 60 FPS animation. This was considered fast enough, and is our final iteration of the waveform renderer.
Conclusion
Understanding the performance cost of drawing techniques on iOS can be tricky. The best way to achieve acceptable performance is to start simple, profile often, and iterate until you hit your target. We significantly improved performance by profiling and identifying the bottleneck at each step, and most of the drawing code from our initial naïve implementation survived to the final performant iteration.
We obtained the biggest win by shifting work from the CPU to
the GPU. Any CoreGraphics drawing done using drawRect: uses the CPU to fill
the layers contents. This is often unavoidable, but if the content
seldom changes, the layer contents can be cached and manipulated by
CoreAnimation on the GPU. After the drawing reduces to manipulating UIView properties,
nearly all of the work can be performed using animations, thereby reducing the amount
of CPU view state updates.
It is important to consider GPU usage, but this is harder to understand intuitively. Profiling with Instruments provides helpful insight, especially the OpenGL ES Driver template, which shows animation FPS and the percentage utilization of the GPU. The main tricks here are to reduce blending and masking, ideally using opaque layers wherever possible. The simulator option “Color Blended Layers” can be useful to identify where you have unnecessary overdraw. For more details see the Apple documentation and WWDC videos.
