How to Reindex One Billion Documents in One Hour at SoundCloud
In the past, the Search Team at SoundCloud had high lead times for making updates to Elasticsearch clusters, either during the implementation of a new feature or simply while fixing a bug. This was because both tasks require us to reindex our catalog from scratch, which means reindexing more than 720 million users, tracks, playlists, and albums. Altogether, this process took up to one week, though there was even one scenario where it almost took one month to roll out a bug fix.
In this post, I would like to share the concrete Elasticsearch tweaks we made so that we can now reindex our entire catalog in one hour.
Search at SoundCloud
At SoundCloud, we use what is canonically known as Kappa Architecture for our search indexing pipeline. The main idea here is: have an immutable data store and stream data to auxiliary stores.
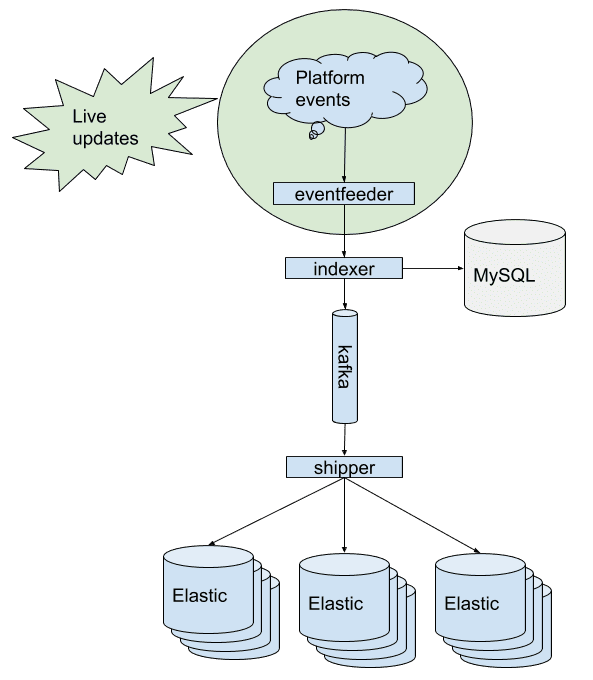
So, how does this work? Once a user, for example, uploads a track or a playlist on SoundCloud, we receive a live update1 in the eventfeeder. Then the indexer fetches the uploaded data2
from our primary data source — MySQL — and creates a JSON document, which is published to Kafka. The Kafka topics have log compaction enabled, which means we will only retain the latest version of the documents. Finally, the shipper reads the JSON documents from Kafka and sends them to Elasticsearch via the bulk API.
Since we use Kafka to back the document storage, we can reindex a new cluster from scratch by simply resetting the Kafka consumer offset of the shipper component, i.e. replaying all stored messages in Kafka.
Elasticsearch Cluster Setup
As you can see in the diagram above, in order to have high availability and isolation of failures, we have three clusters running in production, all with the same dataset. Each cluster consists of 30 Elasticsearch nodes running on 30 boxes. As a general rule of thumb, we try to scale Elasticsearch horizontally instead of vertically, i.e. adding more boxes instead of running multiple Elasticsearch nodes on the same box. This Elastic talk provides a good explanation of why this is the case.
Coming back to our setup, each box consists of:
- 150GB SSD3
- 64GB RAM
- 32 cores
So in total, we have approximately 2TB RAM and 1,000 cores available to serve more than 1,000 search queries per second at peak time.
Our Secret Sauce for Fast Indexing
Now that you’re somewhat familiar with SoundCloud’s indexing pipeline, in this section, I’ll share the concrete Elasticsearch tweaks we implemented that contributed to our performance improvements.
Ingredients
- Concurrent bulk API calls and large bulk size
- Optimal primary shards count
- Async translog setting
- Turned off Elasticsearch refresh
- Merging of Lucene segments
- Faster replication settings
Directions
Bulk API
Make sure that the sending part (in our case, shipper) utilizes the maximum possible combination of bulk size and concurrent requests against the Elasticsearch bulk API. To find this exact sweet spot, try to incrementally increase the batch size until the indexing throughput no longer improves. Since finding the exact sweet spot is a process of trial and error, rinse and repeat!
Primary Shards
Note: The primary shard configuration is a static setting and must be specified during the index creation time.
As a rule of thumb, the count of primary shards defines how well the indexing load is distributed on the available nodes.4 Before we started our spike, we had 10 primary shards distributed on 30 Elasticsearch nodes. Yes, this doesn’t sound like a configuration, because effectively, only 10 machines would be utilized and the rest would be idling. But after changing the primary shard size to 30, we saw lots of improvement in the indexing throughput.
…And do not forget to turn off shard replication during the actual reindex!
Translog
The translog in Elasticsearch is a write-ahead/action log which is needed because the actual internal Lucene commit operation (writing to disk) is an expensive operation due to it occurring synchronously after every write request. The log stores all indexing and delete requests made to Elasticsearch. Furthermore, it also helps with recovery from hardware crashes by replaying all recent acknowledged operations that were not part of the previous Lucene commit.
By default, there is a synchronous fsync that takes place for each indexing request, and the client receives an acknowledgment afterward. But during the reindexing, we usually don’t need this guarantee and could simply restart the process in the case of a hardware failure.
By setting index.translog.durability to async, both the fsync and the Lucene commit will now occur in the background, thereby making the reindexing a lot faster. Remember to set the durability back to the default value(request) once the bulk indexing is done. You can also enhance the flush threshold by changing translog.flush_threshold_size. In our setup, we’re using 2GB. The default value is 512MB.
Refresh Interval
As you may know, the refresh interval in Elasticsearch directly controls when an indexed document will be searchable. Since there are no searches during the reindex, you can turn the refresh process off completely by setting the refresh_interval to -1.
Note: The default refresh interval is one second.
Segment Merging
After the primary shards have been indexed, you may want to turn on shard replication next, but before doing so, allow Elasticsearch to merge Lucene segments via _forcemerge?max_num_segments. In doing so, the index will be compactified before it is replicated, i.e. saving disk space. Currently, we’re investigating the ideal merging strategy in our setup. If you are curious how Lucene’s segment merging works, you can find a great visualization of it here.
Replication
Now there’s only one last thing to do: Turn on shard replication! But before doing so, consider increasing the concurrent shard recoveries per node (default: 2) and the recovering network throttle (default: 20MB) by tweaking cluster.routing.allocation.node_concurrent_recoveries and indices.recovery.max_bytes_per_sec.
In our setup, we are allowing 100 concurrent shard recoveries, and the indices.recovery.max_bytes_per_sec rate is set to 2GB. Make sure you revert it to the previous value before going live!
Nutrition Facts
Indexing Throughput
Before
After
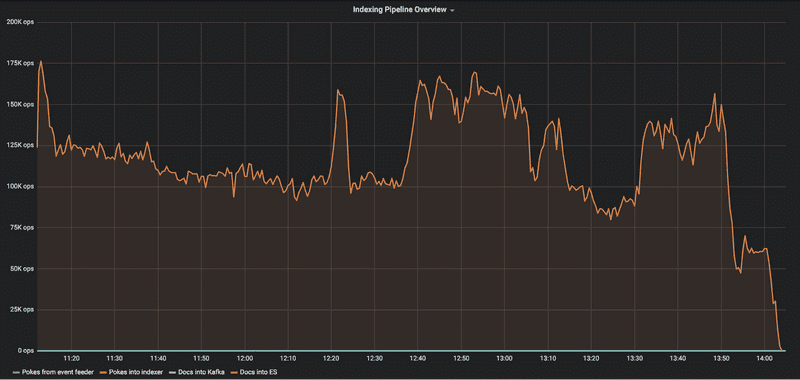
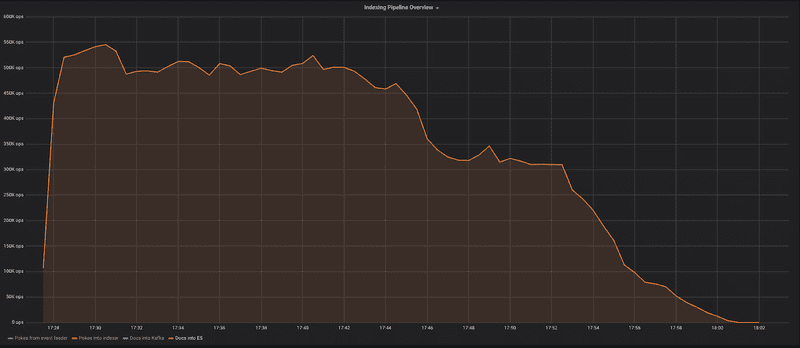
Including the long tail, the primary shard indexing takes around 30 minutes for more than 720 million documents, whereas it previously took three hours.
Search Latency
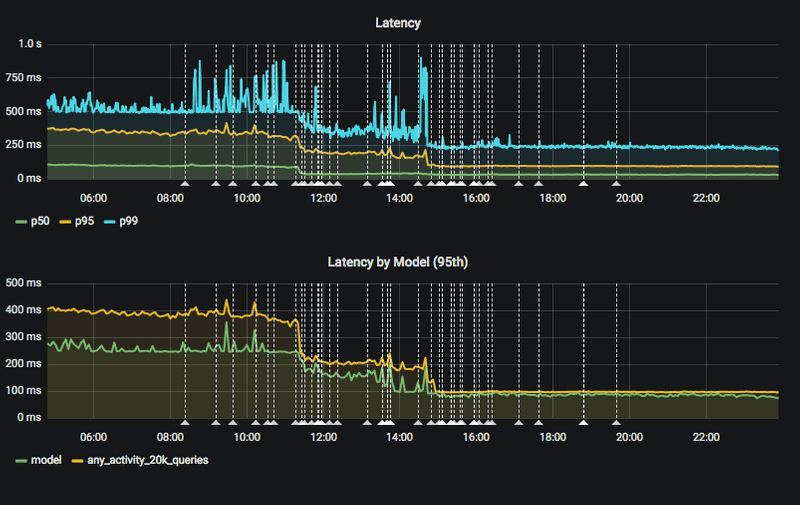
Our search latency for 95 percent of all requests dropped to roughly 90ms5 after rolling out the 30 primary shards configuration.
Note that the listed tweaks above were used in Elasticsearch 5.6.10. Depending on your used version of Elasticsearch, the shown tweaks might not work or could end with slightly different results.
Summary
When we first made the above improvements, we only had two engineers working on the Search Team, and as such, the new lead time for bringing up new clusters enabled us to be much more productive: We could now start an A/B test, prepare a second one, mitigate a recent incident, and reindex a development cluster in one sprint, whereas previously we hardly had room for more than two indexing runs in the same time span!
The shown performance improvements helped to cut down the reindexing time for new clusters from one week to one hour, thereby enabling the Search Team to perform more effectively. In addition, we simultaneously improved the search latency by four times for 95 percent of all search requests.
If our search problems sound interesting to you, then feel free to apply for the currently vacant backend engineer position on the Search Team! We would also love to hear your stories about managing and working with Elasticsearch in production or, in general, any other search-related topic. Don’t hesitate to get in touch via @bashlog.
Future Work
Our work doesn’t stop here. There are, of course, more improvement areas beyond what’s detailed above. In the near future, we plan to further investigate the following topics:
60 Primary Shards:
During a small test, we could reach up to even 1 million indexing op/s with 60 primary shards. A load test is currently pending to verify that the search latency won’t be degraded by having 60 primary shards.
Segment Optimization:
As explained in the segment merging section, we want to verify if having only one segment in the indexing process could eventually result in Lucene segments that are too large.
Smaller Clusters:
Currently, we are running clusters with 30 nodes. Here we want to find out the minimum number of nodes necessary that will allow us to handle the same amount of requests, in addition to having the same indexing performance and search latency for users. Smaller clusters would drastically decrease our operational efforts.
Optimized Schema:
We also want to investigate whether our current schema could be further optimized, e.g. removing unused fields or analyzers. This would make the indexing process faster, and it could also save space.
Bonus Material
Identify and Enhance the Capacities That Make Things Go Right
So, the bonus is the simple idea above, which I thought was worth sharing with you. Instead of the usual focus on why do things go wrong?, one should also ask the opposite question: Why do things go right?
By increasing the capacity of things that go right, we can automatically lower the chance that things go wrong in the first place. In terms of our situation described above, we proactively planned time to improve what was already working, and as a result, we made it a lot better.
TL;DR
In the past, the Search Team at SoundCloud had high lead times for reindexing Elasticsearch clusters. Recently, we optimized the time required for this task, bringing it down from one week to one hour.
This post is a follow-up to a Meetup talk that Rene Treffer (Production Engineer at SoundCloud) and I gave last December at the Berlin Elasticsearch Meetup on the topic of the latest improvements in search.
1: Our average live update rate is 50 documents per second.
2: The data that we actually index in Elasticsearch is a small subset of what is available in MySQL, and it consists of basic fields such as title, description, and user.
3: If you are also using SSDs, make sure your I/O scheduler is configured correctly. See here.
4: Likewise, you can increase the search throughput by increasing the replication. This, of course, makes it necessary to add additional nodes to the cluster.
5: During peak time, the latency for the 95th quantile reaches up to 150ms.


