Congratulations, you have a lot of code!"Congratulations, you have a lot of code!" Remedying Android’s method limit - Part 2
In part one we described how running into Android’s method limit may leave you unable to build, and offered strategies you can employ to make your app fit into a single DEX file. In this part we share an alternative option: using multiple DEX files.
MultiDex
If you have exhausted your options for slimming down your DEX, then there is really only one option left: MultiDex. Enabling MultiDex mode is a simple switch in your build scripts, and it allows you to grow your app beyond the 65k method limit by letting extra code spill over into additional DEX files. This sounds like a great option, but it has a number of repercussions you should be aware of, especially when using it in production and targeting pre-Lollipop versions of Android. The official documentation has more information about these problems.
In a nutshell, multidexing means chopping up your code into multiple DEX files, where normally just one DEX file is created. ART—Android’s new runtime—deals with this effortlessly, since any number of DEX files will be compiled into a single ELF binary before your application loads. However, if you’re aiming at a minSdkLevel below 21 (Lollipop) and need to run on devices that use Dalvik, the tool chain must perform some extra bookkeeping for this to work. This comes with some strings attached:
- You must include the MultiDex support library and modify your application to either inherit from
MultiDexApplicationor invoke the MultiDex loader manually. This is because Dalvik cannot natively deal with multiple DEX files. Luckily, this is safe to do even if you don’t use MultiDex in production builds. - Your build times will increase, since the tool chain will employ ProGuard internally to split out your main application components and their direct dependencies into a primary DEX file, while moving all remaining code to a minimum number of additional DEX files. According to Android SDK lead Xavier Ducrohet, the Android Tools Team is “more than aware than this is a huge problem right now and we’re working on fixing this, but it’s going to be a while.” (quoted from a Slack conversation)
- The
preDexLibariesflag will become inoperable, because the above step cannot be carried out without taking into account all class files, including those from external dependencies. This means that whenever you change a single line of code, the tools need to completely re-dex your app, including all library dependencies. ART does not have this limitation, as all DEX files (one for each runtime library plus those containing your app code) will be embedded in a single OAT file when being compiled down to machine code. Libraries can still be pre-dexed at build time, because they don’t need to be combined at build time. - To use libraries which need to be aware of the full class graph, like Dagger, make sure that additional DEX files are loaded before you create your object graph. That means you cannot create your object graph in your application constructor anymore; instead, you can override
attachBaseContextand create it after calling through tosuper.
A workaround we adopted to get back some of the lost build performance is to create a product flavor which specifies minSdkLevel 21. The toolchain can assume ART as the sole runtime at this API level, and using this product flavor during development is a fair compromise. Keep in mind though that this will affect things like the lint tool, which checks for misuse of platform APIs taking into account your range of API levels. That said, with the workaround in place your build server should still build product flavors that specify the shipping API levels.
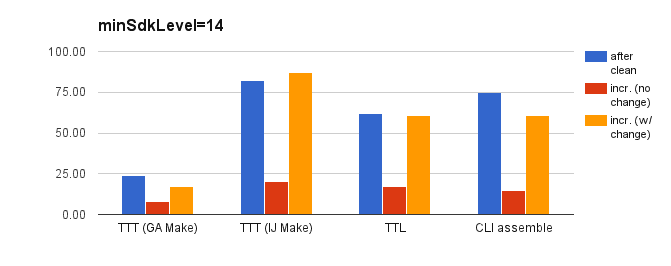
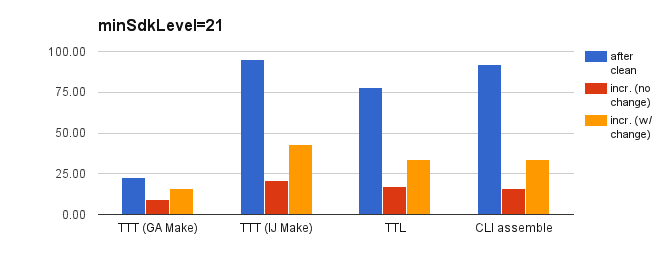
To get an idea of just how much build times would be improved by applying the suggested workaround, we ran a few tests and timed different kinds of builds both on the CLI and in Android Studio using MultiDex. What we measured were 4 things:
- time to test (TTT) using gradle-aware make: time it takes for the test results window to appear in the IDE when running a unit test, i.e. actual test run time is not accounted for
- TTT using Android Studio’s default IntelliJ style make
- time to launcher (TTL): time it takes for the launcher window to appear in the IDE when building/running the app,
- building on the CLI using the
assemble[Flavor]Debugtask.
All of those were run in three variations: after a clean, after no changes, and after a single source file had changed.
Here, time is measured in seconds, so lower is better. From the graphs, looking at the orange bars, you can see that incremental build times have improved drastically when targeting 21 in development, since library pre-dexing is functional again, both in the IDE and on the command line.
Another interesting find here is to leverage what in IntelliJ/AndroidStudio is referred to as “Gradle-aware Make”, which consistently outperforms the default setup when running tests. In the configuration of your IntelliJ runners you can specify which jobs will be executed before launching a test or the app. The default is to use “Make”, which apparently will undermine some of the sophistication we get out of a Gradle based build in terms of incremental builds. By changing this step to app:assemble[Flavor]DebugUnitTest you can shave off unnecessary time from your test runs.
Moving to native
Just to look at the problem from multiple angles, another way to sidestep the DEX method problem is to simply not make code end up in the DEX file to begin with. Pushing code down to the native layer has the benefit that it can live in separate binary modules that can be side loaded at runtime, thus not adding to your overall method count during build time. The decision of whether this is a sensible step to make for you depends largely on your product, organization and team expertise and shouldn’t be made lightly, so we’re merely pointing this out for the sake of completeness.
Method count visibility
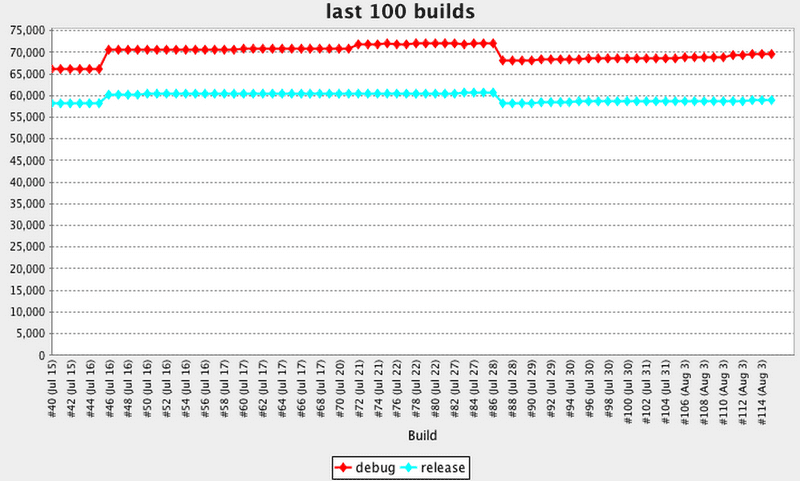
So far we focused on means to solve the DEX count issue. In order to not have it happen at the most inopportune time, it would be desirable to raise awareness around the current method count and notify developers when approaching the method limit. At SoundCloud we have started to monitor application size by plotting the DEX method count trend to a Jenkins graph using the Plot plugin:
We leverage a Gradle plugin to collect the method counts for different build types and store them for every build. Once we go past a certain threshold, we will mark the build as unstable and inform the developers via email. This will hopefully give us enough leeway to address the issue before maneuvering ourselves into a corner again.
Conclusion
Working in a fast moving environment is challenging, and being able to keep delivering product updates is essential to the business. To prevent worst case scenarios like the inability to build, developing both more sensitivity around the cost of third party libraries and getting deeper insights into application health can help. Make sure you understand the impact of leaning on external libraries: how much hidden complexity are you dragging into your app by using it? In case of hitting the limit, know your options: trimming down dependencies and MultiDex is what we ended up leaning on. Last but not least, visibility is king: raising awareness around application size and the looming method limit will allow you to take action ahead of time.
If you’d like to join the Android team, check out our current openings here


